How to Read an ECG: Step-by-Step Clinical Guide
Master 12-lead ECG interpretation, rate calculation, axis determination, ischemia mapping, STEMI equivalents, and arrhythmias.
Table of Contents (11 Sections)

How to Read an ECG: Step-by-Step Clinical Guide
---
📌 Interactive Table of Contents (Index)
- 1. Introduction & Indications
- 2. Technical Standardization & Paper Speed
- 3. The Universal 5-Step ECG Interpretation Algorithm
- 4. Rate, Rhythm & Cardiac Axis Determination
- 5. Ischemia, STEMI & Coronary Territory Mapping
- 6. Advanced Criteria: Sgarbossa & STEMI Equivalents
- 7. Flagship Worked Clinical Case Study
- 8. High-Yield Clinical Pearls & Diagnostic Traps
---
1. Introduction & Indications
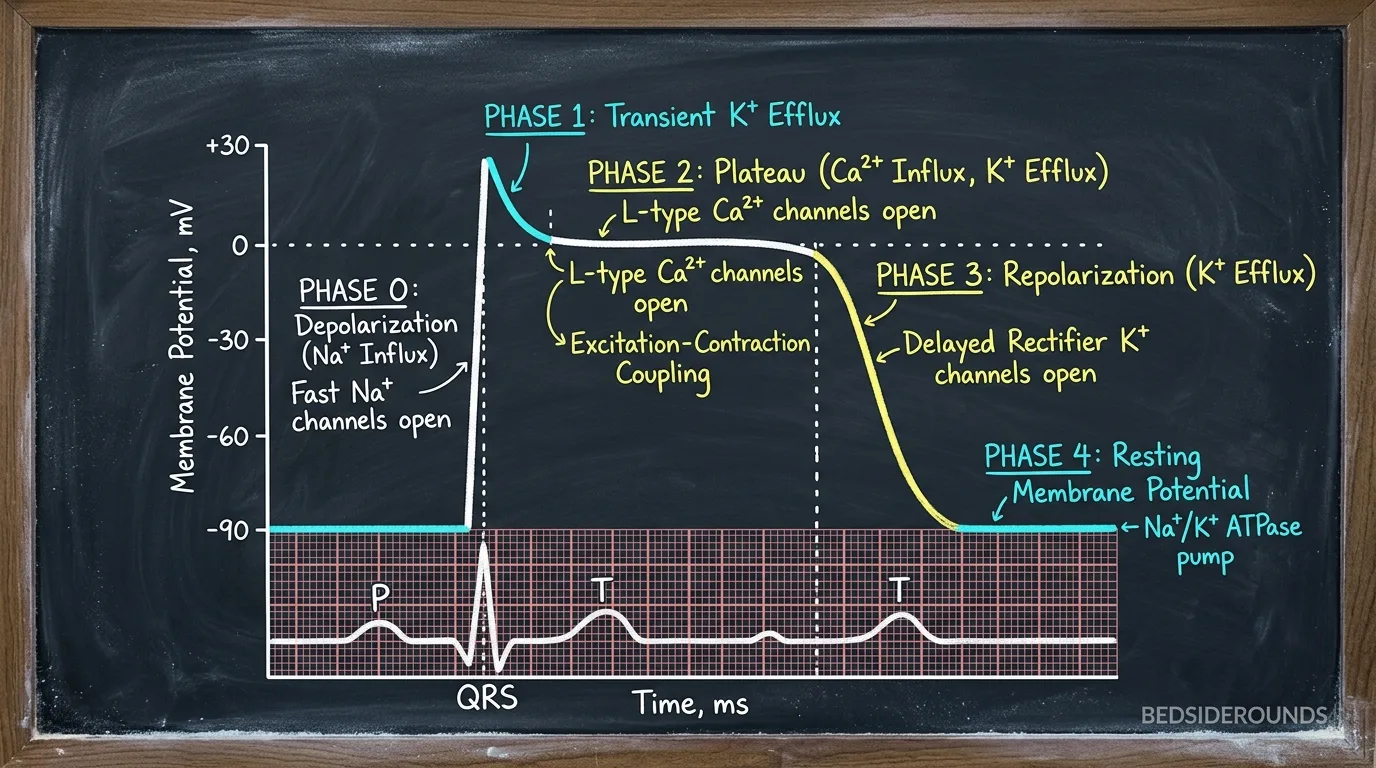
The 12-lead electrocardiogram (ECG) is the premier non-invasive diagnostic biomarker of cardiac electrical activity in acute medicine.
Primary Indications
- Acute Chest Pain or Dyspnea: Rule out acute myocardial infarction, pericarditis, or pulmonary embolism.
- Syncope & Palpitations: Identify lethal ventricular arrhythmias, channelopathies (Brugada, Long QT), or AV blocks.
- Electrolyte & Drug Toxicity: Detect hyperkalemia sine waves, hypokalemia U waves, or digoxin toxicity.
---
2. Technical Standardization & Paper Speed
Before reading any ECG, verify technical calibration:
| Parameter | Standard Value | Clinical Significance | |
|---|---|---|---|
| Paper Speed | 25 mm/sec | 1 mm small box = 0.04 sec (40 ms) | 1 large box = 0.20 sec (200 ms) |
| Voltage Calibration | 10 mm/mV | 10 mm (2 large boxes) = 1 mV | 1 small box = 0.1 mV |
| Lead Placement | Standard 12-lead | V1–V2 (Septal), V3–V4 (Anterior), V5–V6/I/aVL (Lateral), II/III/aVF (Inferior) |
---
3. The Universal 5-Step ECG Interpretation Algorithm
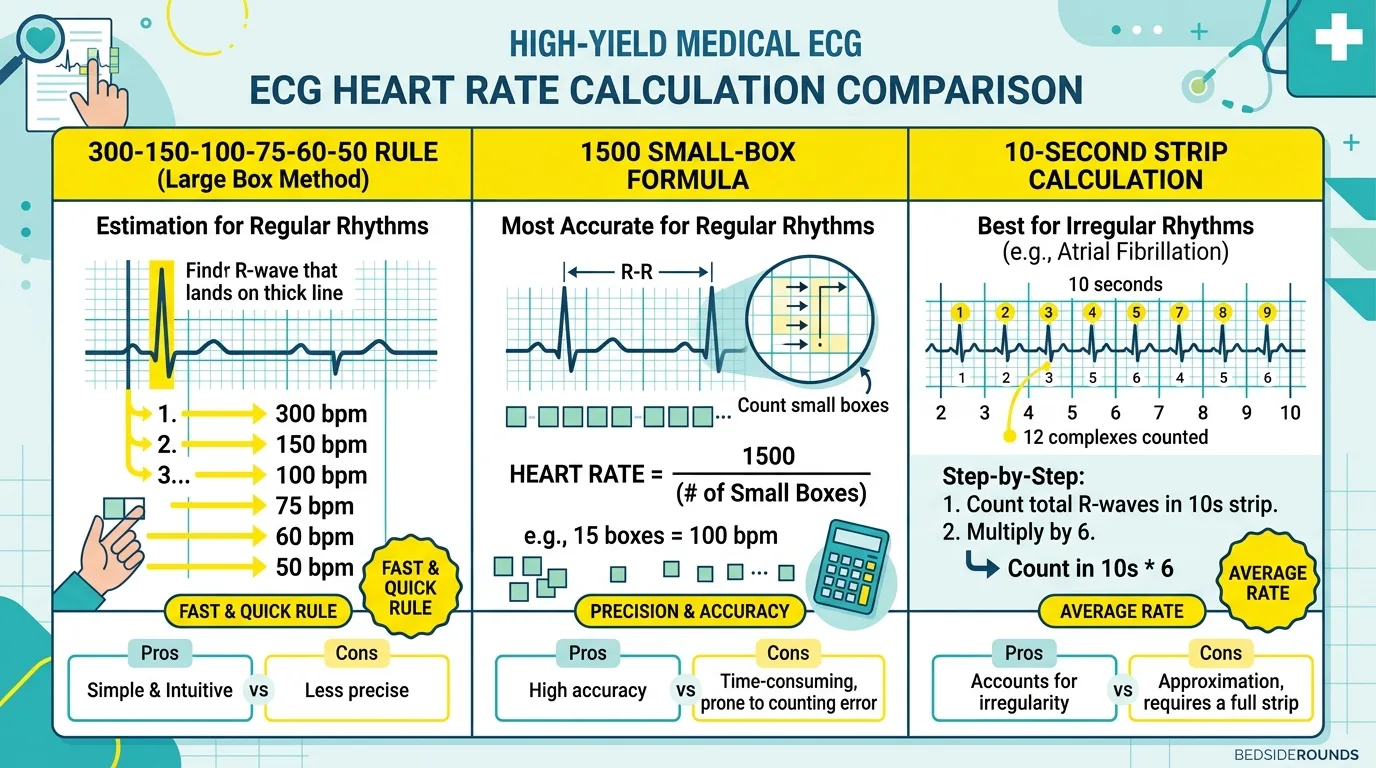
Systematically evaluate every ECG report using these 5 sequential steps:
- Step 1: Calculate Heart Rate
- - Regular rhythm:
300 / (Number of large boxes between R-R) - - Irregular rhythm:
Number of R waves on 10-second rhythm strip × 6 - Step 2: Assess Rhythm & P Waves
- - Is every P wave followed by a QRS? Is the P wave upright in II and inverted in aVR? (Sinus Rhythm).
- Step 3: Determine Cardiac Axis
- - Lead I (+) & aVF (+) = Normal Axis (0° to +90°).
- - Lead I (+) & aVF (-) = Left Axis Deviation (-30° to -90°).
- - Lead I (-) & aVF (+) = Right Axis Deviation (+90° to +180°).
- Step 4: Measure Intervals & Durations
- - PR Interval: Normal 120–200 ms (3–5 small boxes).
- - QRS Duration: Normal <120 ms (<3 small boxes).
- - QTc Interval: Normal <450 ms in males, <460 ms in females (>500 ms = Torsades risk).
- Step 5: Evaluate ST Segments & T Waves
- - Check for ST elevation (STEMI), ST depression (Ischemia/Reciprocal), or T wave inversions.
---
4. Rate, Rhythm & Cardiac Axis Determination
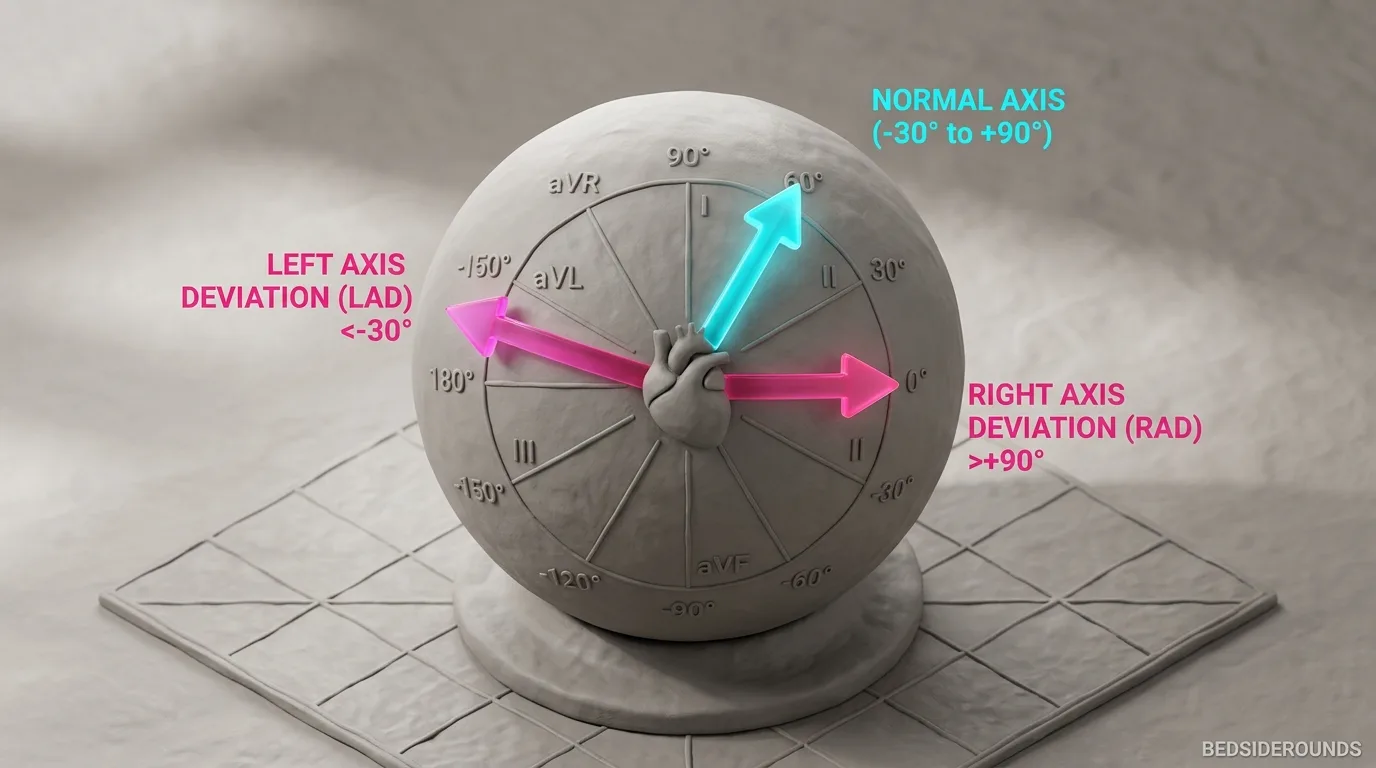
Quick reference table for cardiac axis interpretation:
| Lead I | Lead aVF | Lead II | Cardiac Axis Classification | Common Etiologies |
|---|---|---|---|---|
| Positive (+) | Positive (+) | Positive (+) | Normal Axis (0° to +90°) | Healthy baseline |
| Positive (+) | Negative (-) | Positive (+) | Physiologic Left Axis (0° to -30°) | Normal variant, obesity |
| Positive (+) | Negative (-) | Negative (-) | Pathologic Left Axis Deviation | Left anterior fascicular block (LAFB), LBBB |
| Negative (-) | Positive (+) | Positive (+) | Right Axis Deviation | Right ventricular hypertrophy (RVH), PE, COPD |
---
5. Ischemia, STEMI & Coronary Territory Mapping
Coronary artery occlusion correlates directly with specific lead groupings:
| ECG Territory | Affected ECG Leads | Responsible Coronary Artery | Reciprocal ST Changes |
|---|---|---|---|
| Septal | V1, V2 | Left Anterior Descending (LAD) | None |
| Anterior | V3, V4 | LAD (Mid/Distal) | Inferior leads (II, III, aVF) |
| Lateral | V5, V6, I, aVL | Left Circumflex (LCx) or Diagonal | Inferior leads |
| Inferior | II, III, aVF | Right Coronary Artery (RCA ~85%) | High Lateral (I, aVL) |
| Right Ventricular | V3R, V4R | Proximal RCA | High Lateral |
| Posterior | V7, V8, V9 | LCx or RCA | ST depression in V1–V3 |
---
6. Advanced Criteria: Sgarbossa & STEMI Equivalents
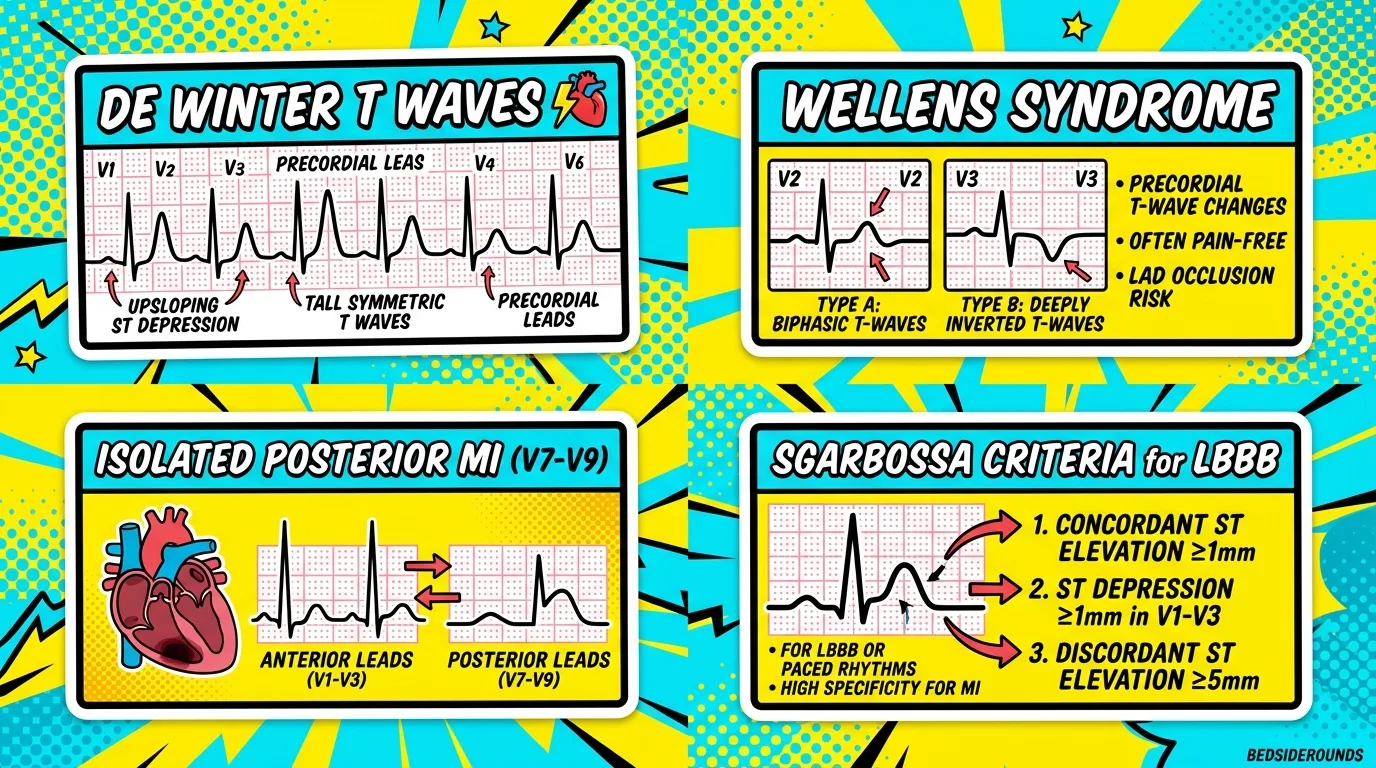
Use these advanced criteria to unmask acute myocardial infarction in complex baselines.
▶ Smith-Modified Sgarbossa Criteria (STEMI in Left Bundle Branch Block)
Presence of ANY 1 of the 3 criteria confirms acute STEMI in LBBB:
1. Concordant ST Elevation: ≥ 1 mm STE in any lead with a positive QRS (Score 5).
2. Concordant ST Depression: ≥ 1 mm STD in V1, V2, or V3 (Score 3).
3. Proportional Discordant STE: ST elevation to S-wave depth ratio (ST / S) ≤ -0.25 (Smith Modification).
▶ De Winter Pattern (Proximal LAD Occlusion Equivalent)
- 1–3 mm upsloping ST depression at J-point in V1–V6.
- Tall, prominent, symmetrical T waves in precordial leads.
- Indicates acute 100% occlusion of the proximal LAD without classic ST elevation.
▶ Wellens Syndrome (Critical LAD Stenosis)
- Type A: Biphasic T waves in V2 and V3 (25% of cases).
- Type B: Deeply inverted, symmetrical T waves in V2 and V3 (75% of cases).
- Represents impending anterior wall MI. Stress testing is contraindicated; prompt angiography required.
---
7. Flagship Worked Clinical Case Study
Worked Case: Acute Pericarditis vs Early Repolarization
Case StudyA 28-year-old resident presents with sharp chest pain that worsens when lying flat and improves when leaning forward.
#### 📊 Patient Lab & ECG Panel
| Parameter | Measured Value | Reference Range | Clinical Interpretation |
|---|---|---|---|
| Heart Rate | 102 bpm | 60 – 100 bpm | Sinus Tachycardia |
| ST-Segment | Concave STE in I, II, V4-V6 | Isoelectric | Diffuse Concave ST Elevation |
| PR-Segment | Depressed in II, aVF, V3-V6 | Isoelectric | PR Depression (Pathognomonic) |
| Lead aVR | ST depression + PR elevation | Normal | Reciprocal PR Elevation in aVR |
| SpO₂ / Troponin | 99% / <0.01 ng/mL | Normal | No acute myocardial necrosis |
#### ⚡ Step-by-Step Diagnostic Flowchart
Step 1: ST Morphology   → Concave "saddle-back" ST elevation across diffuse territories (I, II, aVF, V4-V6)
Step 2: PR Segments     → PR depression in inferior/lateral leads + PR elevation in aVR (Pericarditis hallmark)
Step 3: Reciprocal ST   → No convex ST depression (unlike acute STEMI)
Step 4: ST/T Ratio V6   → ST elevation / T wave amplitude in V6 > 0.25 (Confirms Pericarditis vs BER)
Diagnosis               → Acute Viral Pericarditis (Treat with High-Dose NSAIDs + Colchicine)
---
8. High-Yield Clinical Pearls & Diagnostic Traps
Clinically Related Case Posters
Crushing Chest Pain with Profuse Sweating
Type 2 Diabetes (poorly controlled). Essential Hypertension (on treatment)
Sudden Fast Irregular Heartbeat with Breathlessness
Essential Hypertension (15 years, on treatment). Type 2 Diabetes Mellitus (...
Sharp Chest Pain Worsening when Lying Flat
Recent Upper Respiratory Tract Infection
Test Your Decision-Making in Acute Pericarditis vs Early Repolarization
Experience this exact clinical scenario in the Bedside Rounds interactive simulator. Order investigations, manage door-to-needle timing, and witness real-time physiological feedback.